Devops tool -> link
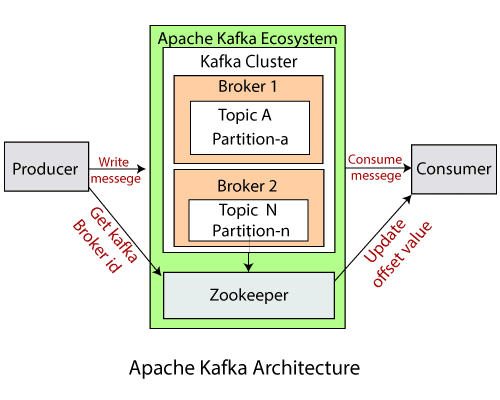
Apache Kafka
interview link1 interview link 2
- kafka offset
- Exact once deliverylink
- https://quix.io/blog/kafka-auto-offset-reset-use-cases-and-pitfalls
- https://eryilmaz0.medium.com/designing-event-consumers-everything-about-commit-offsets-in-kafka-23d3f88472bd
- Kafka
- https://mail-narayank.medium.com/kafka-architecture-internal-d0b3334d1df
- How do you ensure message order is maintained link
- Raft[its replacement of zookeeper] vs Zookeeper
- Kafka(pull model, event processing) vs RabbitMQ(push model, complex message routing)
Redis cache
- RDB snapshot
- Write ahead log
- Basic https://medium.com/codex/7-redis-features-you-might-not-know-bab8c9beb2c
- caching strategies link
- Link For Depth link link2
- Spring boot caching link
- Type and strategies
<dependency><groupId>org.springframework.boot</groupId><artifactId>spring-boot-starter-data-redis-reactive</artifactId></dependency>

opsForList(): For list operations.opsForSet(): For set operations.opsForZSet(): For sorted set operations.opsForHash(): For hash operations.
The value attribute establishes a cache with a specific name, while the key attribute permits the use of Spring Expression Language to compute the key dynamically. Consequently, the method result is stored in the ‘product’ cache, where respective ‘product_id’ serves as the unique key. This approach optimizes caching by associating each result with a distinct key. We can also sue cacheName instead of value
MongoDb
MongoDB is an open-source, cross-platform NoSQL database system. It’s document-oriented and highly scalable, making it easy to store and manage data. It’s known for its speed, robustness and flexibility, and provides a range of features, including indexes, authentication and authorization, and automatic sharding and replication.
MongoDB makes use of collections that is similar to table in Postgres or MySql.

Best Article link link2
Before jumping into mongoDB. Let’s understand how disk storage works and how database stored data on disk.
In a unix file system, we have a hierarchical file system that organizes files and directories into a tree-like structure. In the Unix file system, each file and directory has a unique path, starting from the root directory represented by the “/” symbol.
When a file is created in the Unix file system, it is stored as a sequence of bytes on disk. The disk is divided into blocks, and each file is stored in one or more blocks. The blocks are grouped into larger units called allocation blocks or disk blocks.
The Unix file system uses an inode (short for index node) to manage the storage of a file. An inode is a data structure that contains information about a file, such as its size, creation time, and permissions.
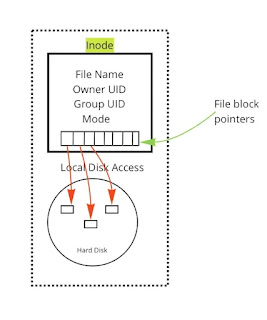
When a file is created, the Unix file system assigns an inode to the file and stores information about the file in the inode. The inode also contains pointers to the disk blocks that store the actual data for the file.
How mongoDB works?
MongoDB uses a memory-mapped file system to store its data. This means that the data is stored on disk in a binary format, and the operating system maps a portion of the file system into memory, allowing MongoDB to access the data directly.
CI/CD pipeline (Jenkins)
pipeline {
    agent any // This means that the pipeline will run on any available agent
    stages {
        stage('Build') {
            steps {
                git 'https://github.com/ajitfawade/node-todo-cicd.git' // This will clone the GitHub repository to the agent's workspace
                docker.build('ajitfawade/node-todo-cicd') // This will build a Docker image using Dockerfile
            }
        }
        stage('Test') {
            steps {
                sh 'npm install' // This will install the dependencies using npm
                sh 'npm test' // This will run the unit tests using npm
            }
        }
        stage('Deploy') {
            steps {
                script {
                    docker.withRegistry('https://registry.hub.docker.com', 'docker-hub-credentials') { // This will use the credentials for Docker Hub that you need to create in Jenkins
                        docker.image('ajitfawade/node-todo-cicd').push() // This will push the Docker image to Docker Hub
                    }
                    withCredentials([usernamePassword(credentialsId: 'kubernetes-credentials', usernameVariable: 'KUBE_USER', passwordVariable: 'KUBE_PASS')]) { // This will use the credentials for Kubernetes that you need to create in Jenkins
                        sh "kubectl --username=${KUBE_USER} --password=${KUBE_PASS} apply -f k8s.yaml" // This will deploy the Docker image to Kubernetes using kubectl and k8s.yaml file
                    }
                }
            }
        }
        stage('Notify') {
            steps {
                emailext ( // This will send an email notification using Email Extension Plugin that you need to install in Jenkins
                    subject: "${env.JOB_NAME} - Build # ${env.BUILD_NUMBER} - ${currentBuild.currentResult}",
                    body: """<p>${env.JOB_NAME} - Build # ${env.BUILD_NUMBER} - ${currentBuild.currentResult}</p>
                             <p>Check console output at <a href="${env.BUILD_URL}">${env.BUILD_URL}</a></p>
                             <p>Access deployed application at <a href="http://node-todo-cicd.k8s.io">http://node-todo-cicd.k8s.io</a></p>""",
                    to: 'ajitfawade@gmail.com'
                )
            }
        }
    }
}
# Stage 1: Build the Spring Boot applicationFROM maven:3.8.6-amazoncorretto-17 AS build123WORKDIR /appCOPY pom.xml .COPY src ./src# Package the application into a JAR fileRUN mvn package -DskipTests# Stage 2: Create the final image (using a smaller JRE base image)FROM amazoncorretto:17-alpine-jdkWORKDIR /app# Copy only the JAR file from the build stageCOPY --from=build123 /app/target/your-app.jar app.jar# Expose the port your Spring Boot app uses (usually 8080)EXPOSE 8080# Set the command to run when the container startsCMD ["java", "-jar", "app.jar"]
Note: Basic Concept:
WORKDIR: Establishes the target directory inside the Docker image.COPY: Copies files or directories from your local filesystem into the directory specified by the precedingWORKDIRinstruction.
The COPY --from=<stage> instruction in a Dockerfile is a powerful feature used in multi-stage builds. It allows you to copy files or directories from a previous stage of your Docker build into the current stage.
In Docker, "mounting" refers to the process of making a directory or file from the host machine accessible inside a container, essentially allowing the container to read and write data from a location on the host system, which is particularly useful for persisting data even when the container is restarted or deleted; this is usually achieved by using a "volume mount" or a "bind mount" command when running a container.
Data persistence:The primary reason for mounting is to ensure data is not lost when a container is stopped or removed, as the data is stored on the host machine.
Accessing host files:You can mount a directory from your host system into the container to access files directly from the host.
Volume vs. Bind Mount:Volume mount: Creates a separate storage area managed by Docker, where data is stored independently from the host system.
Bind mount: Directly mounts a directory from the host machine into the container, meaning changes made inside the container are reflected on the host.
Example:How to handle permissions in docker?755 vs 777 (chmod , chown)To add userFROM openjdk:8-jdk-alpine RUN groupadd -S spring && useradd -u spring -G spring USER spring:spring ARG JAR_FILE=target/*.jar COPY ${JAR_FILE} app.jar ENTRYPOINT ["java","-jar","/app.jar"]
RUN groupadd -g 1001 mygroup && \ useradd -u 1001 -g mygroup myuser
RUN chown -R 1001:1001 /app
USER 1001:1001
Kubernetes interview
RUN groupadd -g 1001 mygroup && useradd -u 1001 -g mygroup myuser:
- Creates a group named
mygroupwith GID 1001.- Creates a user named
myuserwith UID 1001 and adds it to themygroup.- It is very important to use the -g and -u flags to explicitly set the group and user id's.
RUN chown -R 1001:1001 /app:
- Changes the ownership of the
/appdirectory and its contents to the user and group with IDs 1001. The-Rflag makes thechownrecursive, so all files and directories within/appare affected.
USER 1001:1001:
- Switches the user context to the
myuseruser (UID 1001) andmygroup(GID 1001). All subsequent commands will be executed as this user.

# Deployment specification
apiVersion: apps/v1
kind: Deployment
metadata:
  name: my-app
spec:
  replicas: 3 # This defines the desired number of replicas for your application.
  selector:
    matchLabels:
      app: my-app
  template:
    metadata:
      labels:
        app: my-app
    spec:
      containers:
      - name: my-app
        image: my-app:v2 # This is the new image that you want to update to.
        ports:
        - containerPort: 8080
        livenessProbe: # This defines a health check for your pod using an HTTP request.
          httpGet:
            path: /healthz
            port: 8080
          initialDelaySeconds: 10 # This defines how long to wait before performing the first probe.
          periodSeconds: 10 # This defines how often to perform the probe.
          failureThreshold: 3 # This defines how many failures to tolerate before restarting the pod.
        readinessProbe: # This defines a readiness check for your pod using an HTTP request.
          httpGet:
            path: /readyz
            port: 8080
          initialDelaySeconds: 10 # This defines how long to wait before performing the first probe.
          periodSeconds: 10 # This defines how often to perform the probe.
          successThreshold: 2 # This defines how many successes to require before marking the pod as ready.
      serviceAccountName: my-app-sa # This defines the service account that the pod will use to access the Kubernetes API server.
  strategy:
    type: RollingUpdate
    rollingUpdate:
      maxUnavailable: 2 # This means that up to 2 pods can be unavailable during the update process.
      maxSurge: 3 # This means that up to 3 more pods than the desired number can be created during the update process.

# Service specification
apiVersion: v1
kind: Service
metadata:
  name: my-app-service
spec:
  selector:
    app: my-app # This matches the label of the pods that are part of the service.
  ports:
  - protocol: TCP
    port: 80 # This is the port that the service will expose externally.
    targetPort: 8080 # This is the port that the pods will listen on internally.
  type: LoadBalancer # This means that the service will be exposed externally using a cloud provider's load balancer.

# Ingress specification
apiVersion: networking.k8s.io/v1beta1
kind: Ingress
metadata:
  name: my-app-ingress
spec:
  rules:
  - host: my-app.example.com # This is the host name that will be used to access the service from outside the cluster.
    http:
      paths:
      - path: / # This is the path that will be used to access the service from outside the cluster.
        backend:
          serviceName: my-app-service # This refers to the name of the service that will handle the traffic.
          servicePort: 80 # This refers to the port of the service that will handle the traffic.
Kubeconfig

- How to handle secrets? link
- How to handle auto scaling in k8shttps://medium.com/@extio/the-power-of-kubernetes-auto-scaling-scaling-your-applications-with-ease-cb232391400c
- kubeconfig file link
- k8s in jenkins pipeline link
Imp: link1 link2
https://yuminlee2.medium.com/kubernetes-kubeconfig-file-4aabe3b04ade
https://medium.com/@vinoji2005/using-terraform-with-kubernetes-a-comprehensive-guide-237f6bbb0586
Terraform intro
# Configure the Azure provider
terraform {
required_providers {
azurerm = {
source = "hashicorp/azurerm"
version = "~> 3.0.2"
}
}
required_version = ">= 1.1.0"
}
provider "azurerm" {
features {} //subscription detail here
}
resource "azurerm_resource_group" "rg" {
name = "rg-aks-test-001"
location = "australiaeast"
}
resource "azurerm_kubernetes_cluster" "default" {
name = "aks-test-001"
location = "australiaeast"
resource_group_name = "rg-aks-test-001"
dns_prefix = "dns-k8s-test"
kubernetes_version = "1.27.9"
default_node_pool {
name = "testnodepool"
node_count = 2
vm_size = "Standard_D2_v2"
os_disk_size_gb = 30
}
service_principal {
client_id = var.clientId
client_secret = var.clientSecret
}
role_based_access_control_enabled = true
tags = {
environment = "test"
}
}
Basic Structure (for smaller projects):
├── main.tf
├── variables.tf
├── outputs.tf
├── terraform.tfvars
main.tf: This is the primary file where you define your resources.variables.tf: This file contains the definitions of your Terraform variables.outputs.tf: This file defines the output values that Terraform will display after applying your configuration.terraform.tfvars: This file stores the actual values for your Terraform variables. It should not be committed to version control if it contains sensitive data.
Elastic Search link link2
Elasticsearch is a document oriented database.Elasticsearch uses JSON documents to store data, making it flexible and easy to work with.
Observability in Microservices(open telemetry-> logging, tracing)
- Traces: Records the flow of a request as it traverses through different services and components, providing visibility into complex service dependencies.
- Metrics: Measures the performance of applications by collecting data such as request counts, CPU usage, and response times.
- Logs: Collects log data that records events, errors, and warnings, providing contextual information for troubleshooting.
OpenTelemetry link
OpenTelemetry is a Cloud Native Computing Foundation (CNCF) project designed to create a standardized way to collect telemetry data (i.e., traces, metrics, and logs) from various applications and programming languages. It unifies different observability signals under a single framework, making it easier to gain a complete view of application performance and identify issues across distributed systems.
OpenTelemetry (OTel) is an open-source framework that collects and exports telemetry data from applications and services. It's used to monitor and analyze software performance and behavior. The OpenTelemetry collector is in charge of collecting, processing, and exporting collected telemetry data. It is vendor-agnostic(open source) and provides capabilities for cost reduction and easy management.
Micrometer link
Micrometer Tracing is a facade over the Brave and OpenTelemetry tracers that gives insight into complex distributed systems at the level of an individual user request. Identify the root cause of issues faster with distributed tracing.
You can think of Micrometer as a specialized tool focused solely on metrics collection for Java-based applications, while OpenTelemetry is a broader observability framework that goes beyond just metrics and supports traces, metrics, and logs for applications written in various programming languages.
Diff between opentelemetry vs micrometer
Explain difference between micrometer and actuator in spring boot
- Actuator is the foundation, Micrometer is the instrument: Actuator provides the framework for exposing metrics, while Micrometer is the tool you use to collect and structure those metrics.
- Actuator exposes Micrometer metrics: When you use Micrometer in your Spring Boot application, Actuator automatically configures it and exposes the metrics through its
/metricsendpoint. - Actuator provides more than just metrics: Actuator offers a wider range of management and monitoring capabilities beyond just metrics, such as health checks, environment information, and more.
Explain how metrics can be collected from spring boot application to prometheus
Prometheus(metrics, stats)
Data pull and storage tool Architecture
The general term for collecting metrics from the targets using Prometheus is called scraping.
https://devopscube.com/prometheus-architecture/

.jpg)
Grafana
Prometheus is used along with grafana for health monitoring and metrics. Prometheus is time series database. To pull data(can be push also but not used that way in general) by prometheus application or node should expose endpoints /metrics. Spring boot exposes endpoints through actuator and micrometer make data available in prometheus format. Micrometer is facade for collecting metrics data. PromQL is a query lanaguage.
- Micrometer with grafana and prometheus : link
- Micrometer for tracing(Facade for various services) link
- There are various other tool for observability like Datadog, Splunk, Datarelics, AppDynamics, etc
Cross Cutting concerns link
The microservices chassis is a set of frameworks that address numerous cross-cutting concerns such as
- Externalized configuration
- Health checks
- Application metrics
- Service Discovery
- Circuit breakers
- Distributed tracing
- Exception tracking
Monitoring Application
The specific stats you monitor will depend on your application's architecture, technology stack, and business requirements. However, here are some fundamental categories and key metrics to consider:
A. Performance Metrics:
- Request Latency/Response Time:
- Average Latency: The average time it takes to serve a request.
- P95, P99, P99.9 Latency: The time within which 95%, 99%, or 99.9% of requests are served. These high percentiles are crucial for understanding tail latency and user experience for the slowest requests.
- Latency Breakdown: If using APM, observe the breakdown of latency across different components of the request lifecycle (e.g., network, application code, database queries, external service calls).
- Throughput:
- Requests Per Second (RPS): The number of requests your application handles per second.
- Error Rate:
- HTTP Error Codes (4xx, 5xx): The rate of client-side and server-side errors. High 5xx rates indicate problems within your application.
- Application-Specific Errors: The rate of errors logged or reported by your application code.
- Resource Utilization (Per Instance/Pod):
- CPU Utilization (%): The percentage of CPU resources being used. High sustained CPU can indicate performance bottlenecks or resource exhaustion.
- Memory Utilization (% or absolute): The amount of RAM being used. High memory usage can lead to performance degradation or out-of-memory errors. Observe both heap and non-heap memory for JVM-based applications.
- Disk I/O (Read/Write): The rate of data being read from and written to disk. High I/O can be a bottleneck for certain applications.
- Network I/O (Traffic In/Out): The amount of network traffic being sent and received. High network usage might indicate performance issues or security concerns.
B. Application-Specific Metrics:
- Database Performance:
- Query Latency: The time it takes for database queries to execute.
- Query Throughput: The number of database queries executed per second.
- Connection Pool Statistics: Active, idle, and waiting connections in your database connection pool.
- Error Rates: Database connection errors or query execution errors.
- Cache Performance:
- Hit Rate: The percentage of requests served from the cache. A low hit rate indicates inefficient caching.
- Miss Rate: The percentage of requests that had to go to the underlying data source.
- Eviction Rate: How frequently items are being evicted from the cache.
- External Service Dependencies:
- Latency to External Services: The time it takes to communicate with other microservices or external APIs.
- Error Rates from External Services: The rate of errors received from external dependencies.
- Background Job Performance:
- Processing Time: The duration of background jobs.
- Queue Length: The number of pending jobs in the queue.
- Failure Rate: The rate at which background jobs fail.
- Custom Business Metrics: Metrics relevant to your specific application domain (e.g., number of new user registrations, order processing time, payment success rate).
C. Health and Availability Metrics:
- Instance/Pod Health: Status of your application instances or Kubernetes pods (e.g., running, ready, failing).
- Uptime: The duration for which your application has been running without interruption.
- Service Availability: Whether your application is reachable and responding to requests. Synthetic monitoring (proactive checks from outside your infrastructure) can be used to measure this.
- Load Balancer Health Checks: Status of health checks performed by your load balancer.
D. User Experience Metrics (Often collected through Real User Monitoring - RUM):
- Page Load Time: The time it takes for web pages to load in users' browsers.
- Time to First Byte (TTFB): The time it takes for the browser to receive the first byte of the response from the server.
- Frontend Errors (JavaScript errors): Errors occurring in the user's browser.
- User Interactions: Metrics on how users are interacting with your application (e.g., click rates, time spent on page).
III. Best Practices for Monitoring:
- Monitor Key Performance Indicators (KPIs): Focus on the metrics that directly impact your business goals and user experience.
- Establish Baselines: Understand the normal behavior of your application to effectively detect anomalies.
- Set Meaningful Alerts: Configure alerts for critical thresholds that indicate potential problems. Avoid alert fatigue by making alerts actionable.
- Correlate Metrics and Logs: Use log data to provide context to metric anomalies and aid in troubleshooting.
- Visualize Data Effectively: Create clear and informative dashboards that provide a holistic view of your application's health and performance.
- Automate Monitoring Setup: Use infrastructure-as-code tools to manage your monitoring infrastructure.
- Continuously Review and Refine: Regularly review your monitoring setup and adjust it as your application evolves.
- Implement Synthetic Monitoring: Proactively test your application's availability and basic functionality from different locations.
- Consider Full-Stack Observability: Aim for a comprehensive view of your system, including metrics, logs, and traces, to understand the entire request lifecycle.
Load testing
Jmeter (load testing)
Jmeter (load testing)
https://blog.bigoodyssey.com/rest-api-load-testing-with-apache-jmeter-a4d25ea2b7b6
K6 (Load testing)
https://blog.stackademic.com/optimizing-api-performance-through-k6-load-testing-b38cf1ff457c
Cypress or Enzyme(UI testing)
Testing framework
Micrometer(Stats or obervability)
Opentelemtry for tracing log(along with Jaeger or zipkin) link
understand context propagation in opentelemetry
Distributed transaction
link1 link2How autoscaling is done in k8s
ssh protocol or key


No comments:
Post a Comment